
An Overview of Mississippi Agricultural Industry Deaths, 2017–2021
Introduction
This publication provides an overview of agricultural industry deaths in Mississippi from 2017 to 2021. Deaths are separated by the decedent’s demographic characteristics, their region of residence, and cause of death. Mortality data is also provided for Mississippi residents not in the agricultural industry during the same time frame for comparison purposes. This publication can be used by public health officials in Mississippi who work with rural agricultural communities. Based on the findings of this publication, targeted public health programs can be created to reduce the number of avoidable deaths for agricultural industry employees in the state.
Data Sources
Data for this publication is provided by the Mississippi Department of Health, Bureau of Vital Records. Deaths in the agricultural industry are mortalities where the death certificate listed an agriculture-related industry or occupation for the decedent under the categories usual occupation (kind of work done most of working life) or kind of business or industry. Non-agricultural industry deaths include mortalities in Mississippi where the decedent did not work in the agricultural industry. For this publication, deaths from 2017 to 2021 are aggregated.
Demographics / Region of Residence
Between 2017 and 2021, there were 6,619 agricultural industry deaths in Mississippi and 172,278 non-agricultural industry deaths. The findings in Figures 1 through 3 and Table 1 show both agricultural industry and non-agricultural industry deaths separated by the decedent’s age, sex, race, and region of residence.
Age

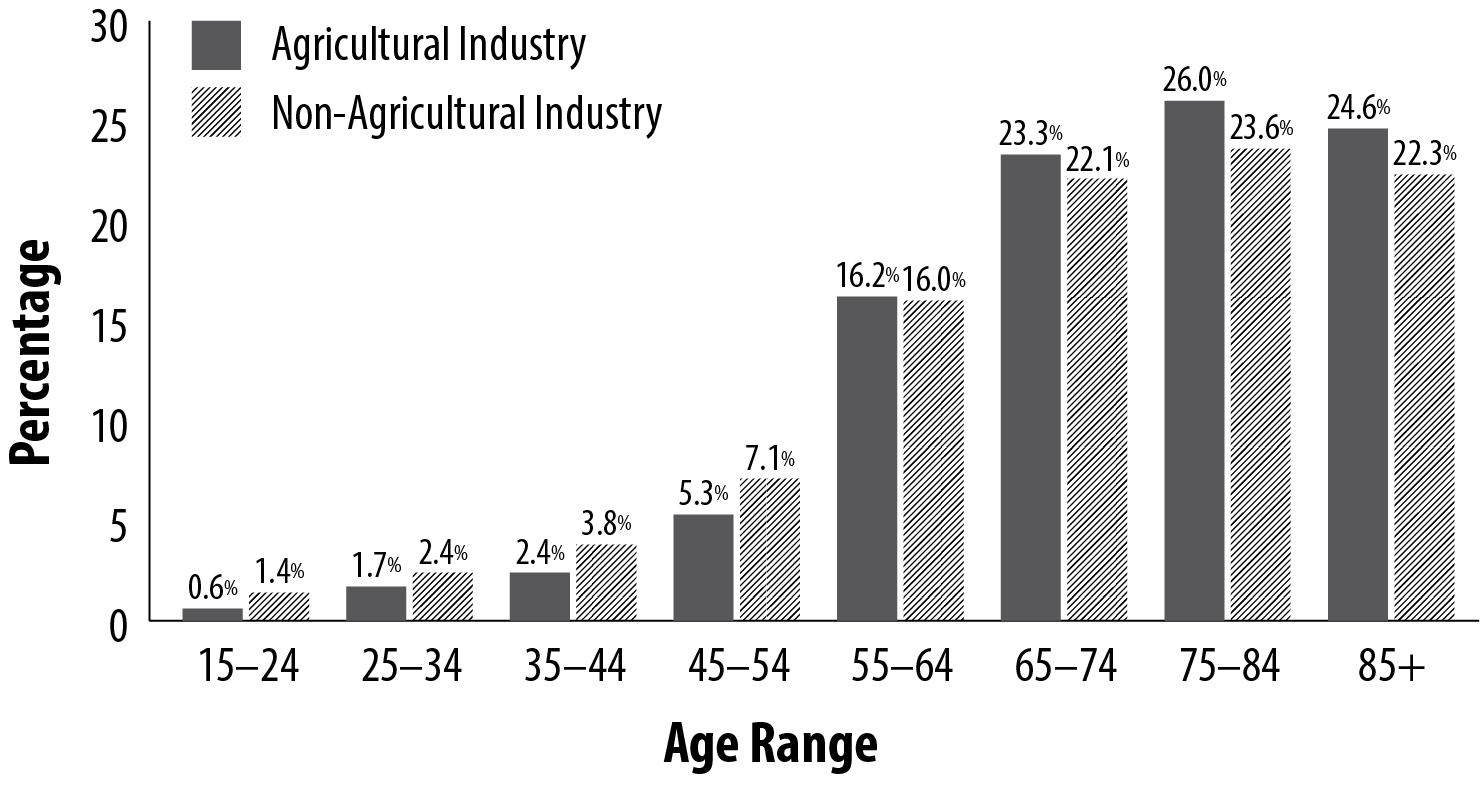
Figure 1 displays the percentage of both agricultural industry and non-agricultural industry deaths by decedent age. Similar trends are observed in both groups with the percentage of total deaths increasing as age increases. Interestingly, the percentage of deaths for non-agricultural industry decedents is higher than the percentage of deaths in the agricultural industry for age categories 15–24, 25–34, 35–44, and 45–54. Very similar percentages of total deaths are seen between the two groups in the 55–64 age category. For age categories 65–74, 75–84, and 85+, the agricultural industry has a higher percentage of deaths in comparison to residents outside the agricultural industry.
Sex
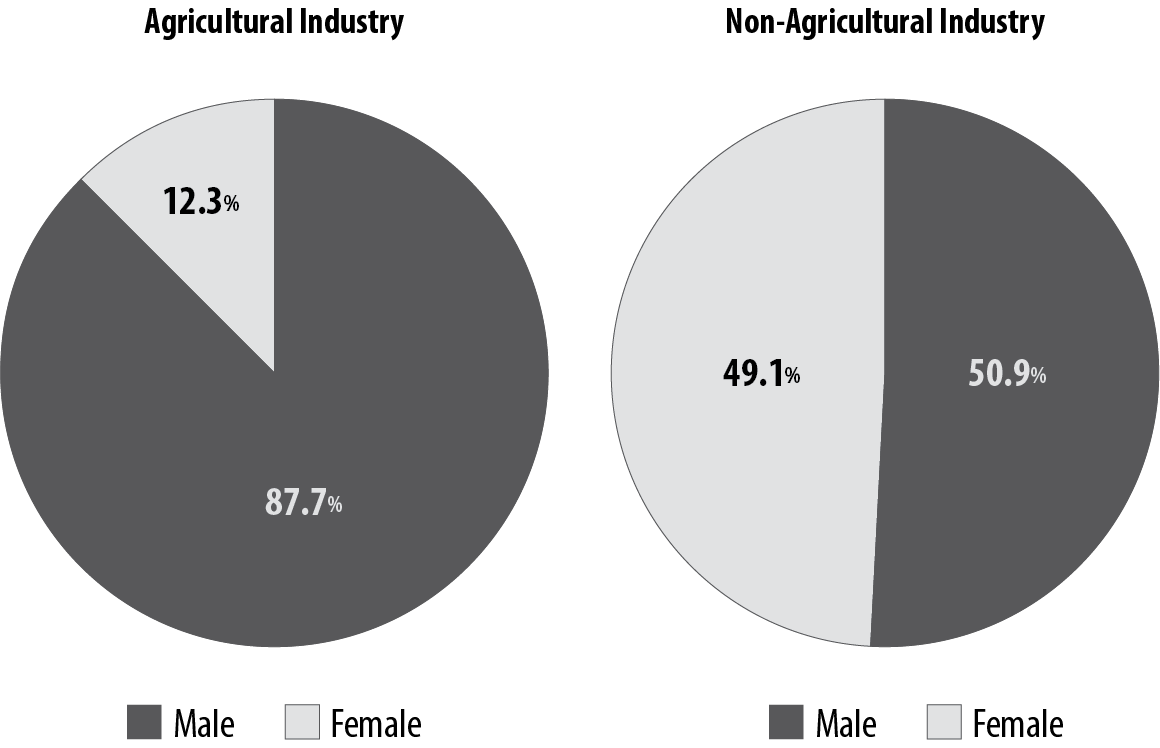
The percentage of agricultural industry and non-agricultural industry deaths by decedent sex is seen in Figure 2. Decedents in the agricultural industry were predominantly male, making up 87.7 percent of deaths. Decedents in the non-agricultural industry group were more evenly split between male and female (50.9 percent and 49.1 percent, respectively).
Race
|
Race |
Agricultural |
Non-agricultural industry |
|
White |
56.9% |
66.2% |
|
African American |
41.6% |
32.9% |
|
American Indian |
0.5% |
0.4% |
|
Asian/Pacific Islander |
1.0% |
0.4% |
|
Other |
0.1% |
0.1% |
Table 1 shows the percentage of deaths in the agricultural industry and non-agricultural industry by decedent race. For both the agricultural industry and non-agricultural industry groups, over half of total decedents were white. For agricultural industry decedents, 41.6 percent were African American compared to 32.9 percent of decedents in the non-agricultural industry group. Comparative percentages of total deaths are observed between the two groups for the American Indian, Asian/Pacific Islander, and other race categories.
Region of Residence
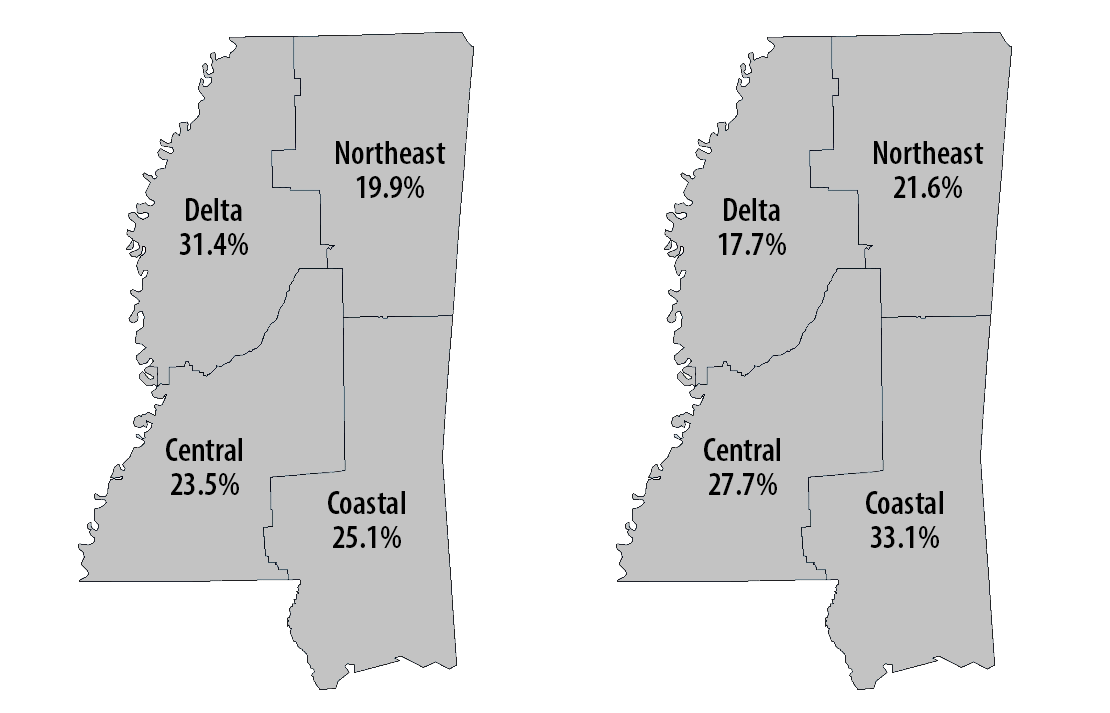
The two maps in Figure 3 show the percentage of total deaths by the decedent’s region of residence. The map on the left shows agricultural industry deaths; the map on the right shows non-agricultural industry deaths. For the agricultural industry, the Delta region represents the highest percentage of deaths at 31.4 percent, and the Northeast region had the lowest share at 19.9 percent. Figure 3 shows different results for decedents in the non-agricultural industry. For the non-agricultural industry group, the Coastal region had the highest percentage of total deaths at 33.1 percent while the Delta region had the lowest percentage at 17.7 percent.
Cause of Death
Tables 2 and 3 show agricultural industry and non-agricultural industry deaths separated by the decedent’s underlying cause of death. Table 2 displays the top five causes of death by number of deaths for the agricultural industry and non-agricultural industry when the stated cause of death was an illness or disease. Table 3 displays the top five causes of death by count for the agricultural industry and non-agricultural industry when the cause of death was listed as an external factor. In both tables, values are shown for deaths not in the agricultural industry group for comparison purposes.
Disease and Illness
|
Cause of death |
Agricultural industry’s number of total deaths (%) |
Non-agricultural industry’s number of total deaths (%) |
|
Circulatory disease |
2,167 (32.7%) |
52,708 (30.6%) |
|
Neoplasms |
1,243 (18.8%) |
31,715 (18.4%) |
|
Respiratory disease |
662 (10.0%) |
17,730 (10.3%) |
|
COVID-19 |
431 (6.5%) |
9,125 (5.3%) |
|
Nervous system disease |
406 (6.1%) |
13,053 (7.6%) |
The top five causes of death among diseases and illnesses for both agricultural and non-agricultural industry decedents are displayed in Table 2. The top five disease and illness causes of death for the agricultural industry group were (1) circulatory disease, (2) neoplasms (including cancer), (3) respiratory disease, (4) COVID-19, and (5) nervous system disease. Examining the percentage of total deaths for both agricultural and non-agricultural industry groups, similar rates are observed for deaths attributable to neoplasms and respiratory disease. The agricultural industry had a slightly higher percentage of deaths from circulatory disease and COVID-19 compared to decedents outside the agricultural industry. Alternatively, non-agricultural industry decedents had a higher percentage of deaths caused by nervous system diseases.
External Causes
|
Cause of death |
Agricultural industry’s number of total deaths (%) |
Non-agricultural industry’s number of total deaths (%) |
|
Transportation accident |
176 (2.7%) |
3,879 (2.3%) |
|
Intentional self-harm |
73 (1.1%) |
2,117 (1.2%) |
|
Assault |
71 (1.1%) |
2,329 (1.4%) |
|
Fall |
52 (0.8%) |
1,540 (0.9%) |
|
Accidental poisoning by or exposure to noxious substance |
44 (0.7%) |
2,317 (1.3%) |
Table 3 shows the top five causes of death for agricultural industry decedents when the cause of death was identified as an external cause. Table 3 also shows the number of deaths among decedents in the non-agricultural industry by the same causes of death. The top five causes of death by external causes in the agricultural industry were (1) transportation accidents, (2) intentional self-harm, (3) assault, (4) falls, and (5) accidental poisoning by or exposure to noxious substances. Between both groups, similar percentages of total deaths are seen for transportation accidents, intentional self-harm, assault, and falls. Non-agricultural industry decedents had a higher percentage of total deaths attributable to accidental poisoning by or exposure to noxious substances compared to the agricultural industry group.
Summary
This publication provides an overview of agricultural industry deaths in Mississippi for years 2017–2021. When comparing decedents in the agricultural industry to non-agricultural industry decedents, differences were observed in terms of their demographic characteristics and region of residence. For the most part, however, the two groups’ causes of death among both disease/illness and external causes were similar when evaluating the percentage of total deaths. Due to the dangerous and physically stressful nature of farming, it is important to evaluate agricultural industry deaths in order to implement steps that reduce the number of preventable deaths.
Reference
Mississippi Department of Health. (2023). Provisional Death Certificate Counts for Agriculture Industry Mississippi Residents, 2017-2021 [Dataset].
Publication 3986 (POD-01-24)
By Devon Mills, PhD, Assistant Professor, Agricultural Economics; Mary Nelson Robertson, PhD, Assistant Professor, Human Development and Family Science; David R. Buys, PhD, Associate Professor, Food Science, Nutrition, and Health Promotion; and Brian E. Mills, PhD, Assistant Professor, Agricultural Economics.

The Mississippi State University Extension Service is working to ensure all web content is accessible to all users. If you need assistance accessing any of our content, please email the webteam or call 662-325-2262.